Employee engagement KPIs: What to measure (and how HR teams can use the data)
Employee engagement KPIs help you measure sentiment, retention, and burnout risk. Learn what to track, how to report, and improve engagement faster.


Employee engagement and employee satisfaction are two of the clearest signs of company health, but they’re also easy to misread. Engagement reflects how invested employees are in their work (emotionally and behaviorally). Satisfaction reflects how they feel about their day-to-day experience: workload, leadership, growth, culture, and support.
Everyone knows engagement matters. The hard part is tracking what’s improving, what’s driving results, and where problems are emerging.
The right KPIs help you catch early warning signs like burnout, rising turnover risk, and performance drag, before they show up in exit interviews, missed goals, or declining customer satisfaction.
In this article, we’re breaking down the employee engagement KPIs that matter most, and how to track them in a way that’s simple, consistent, and easy to report on.

Table of contents
- Employee engagement KPIs: What to measure (and how HR teams can use the data)
- The engagement KPI framework (4 buckets that cover the full picture)
- KPI Cheat Sheet (Formulas + Suggested Cadence)
- Conclusion
- Frequently asked questions
Quick answer
Employee engagement KPIs help HR teams measure how employees feel, how often they participate, and what outcomes follow (like retention and burnout risk). The best approach is to track a small set of KPIs across sentiment, participation, talent outcomes, and early warning signs, then act on the trends consistently.
The engagement KPI framework (4 buckets that cover the full picture)
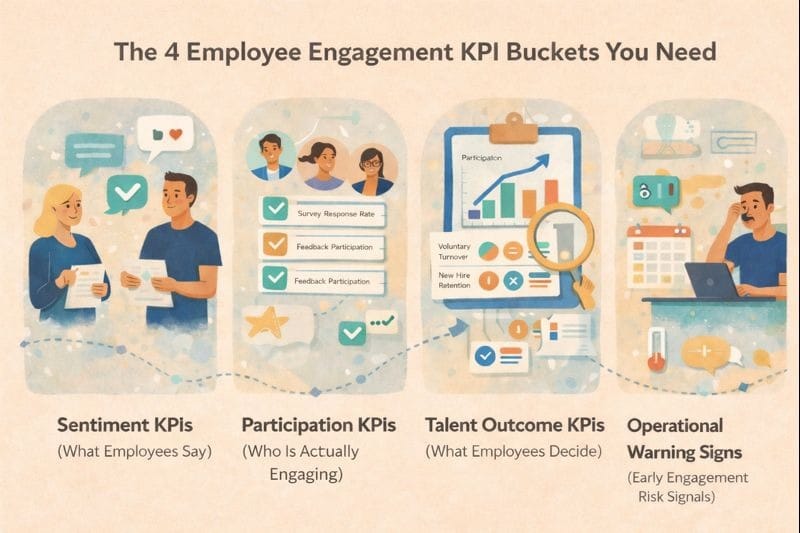
When teams start measuring engagement, they usually make the same mistake: they track too many KPIs with no structure.
The result? A long dashboard that looks impressive…but doesn’t tell you what to fix first.
Instead, keep things simple by grouping employee engagement Key Performance Indicators (KPIs) into four buckets. This gives you the full picture without making reporting (or action planning) a nightmare.
1) Sentiment KPIs (what employees say)
These are your leading indicators. They show how employees feel right now, often before disengagement shows up as absenteeism, turnover, or performance issues.
Employee net promoter score (eNPS)
What it tells you: Employee advocacy and loyalty, if employees would recommend your organization as a place to work.
How to measure it: Ask one core question:“How likely are you to recommend this company as a place to work?” (0–10)Then add a follow-up: “What’s the main reason for your score?”
Formula: % Promoters − % Detractors
Employee satisfaction score (ESAT/ESS)
What it tells you: Overall employee satisfaction with the day-to-day experience, including role clarity, work environment, leadership, tools, and support.
How to measure it: Ask employees to rate satisfaction across key areas (1–5 or 1–10 scale), such as:
- workload and expectations
- communication and leadership trust
- compensation and benefits (if in scope)
- career growth and employee development
- team culture and belonging
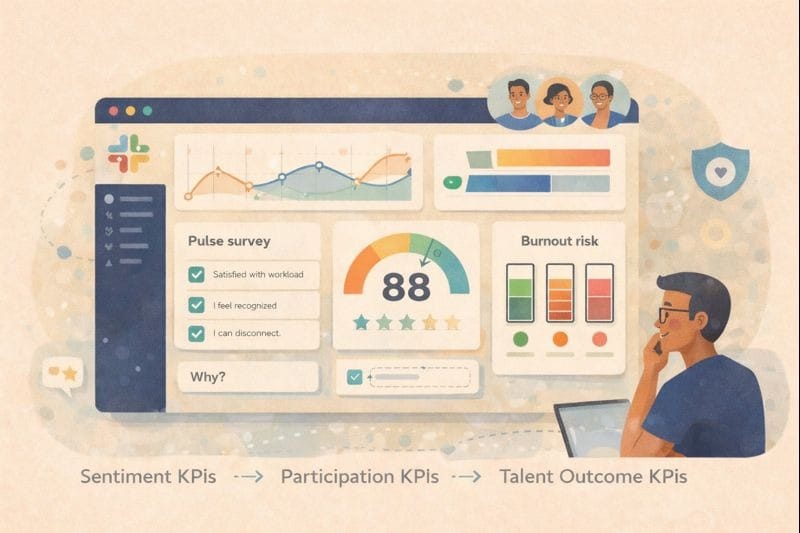
Pulse survey score
What it tells you: Short-term movement in engagement drivers, useful for spotting changes early and responding faster.
How to measure it: Run short pulse surveys with 3–5 questions monthly or biweekly. These employee engagement surveys work best when you rotate one “theme” question (workload, recognition, manager support) while keeping a few consistent baseline questions.
To go deeper, explore our Employee Engagement Surveys Questions: The Ultimate Guide for ready-to-use pulse survey questions and best practices.
Work-life balance/burnout risk score
What it tells you: If employee performance is sustainable, or if employees are trending toward burnout, fatigue, and disengagement.
How to measure it: Use questions that reflect workload sustainability and recovery, such as:
- “My workload is manageable.”
- “I can disconnect outside of work hours.”
- “I have the resources I need to do my job effectively.
👉 Want to measure employee engagement without adding another tool to your HR stack? With Pulsy by BuddiesHR, you can run eNPS and pulse surveys directly in Slack, making it easier to reach employees and improve response rates.
2) Participation KPIs (who is actually engaging)
Participation KPIs show whether employees are buying into your engagement efforts. If participation drops, it’s usually because people don’t feel safe, don’t see results, or are simply too overloaded to respond.
Here are the participation KPIs that matter most:
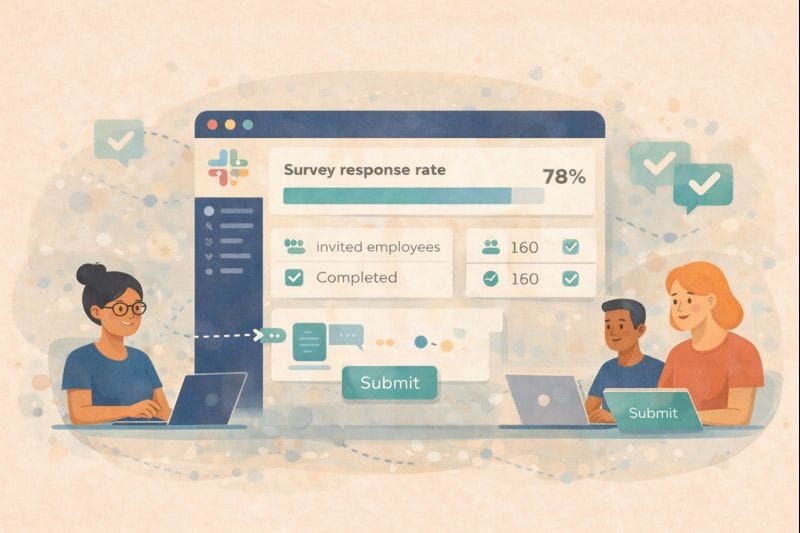
Survey response rate
What it tells you: Trust in the process, relevance of the questions, and potential survey fatigue.
How to measure it: Track completion rates across engagement surveys, pulse surveys, and department check-ins.
Formula: (Completed surveys ÷ Invited employees) × 100
Recognition participation rate
What it tells you: If appreciation and reinforcement are happening consistently across the organization, or only in certain teams.
How to measure it: Track the percentage of employees who give and/or receive recognition within a defined period (monthly or quarterly).
Employee feedback participation (ideas, suggestions, comments)
What it tells you: If employees feel ownership, psychological safety, and believe that their voice matters.
How to measure it: Track both:
- number of contributors (how many people participate), and
- quality of feedback (how many suggestions are actionable)
3) Talent outcome KPIs (what employees decide)
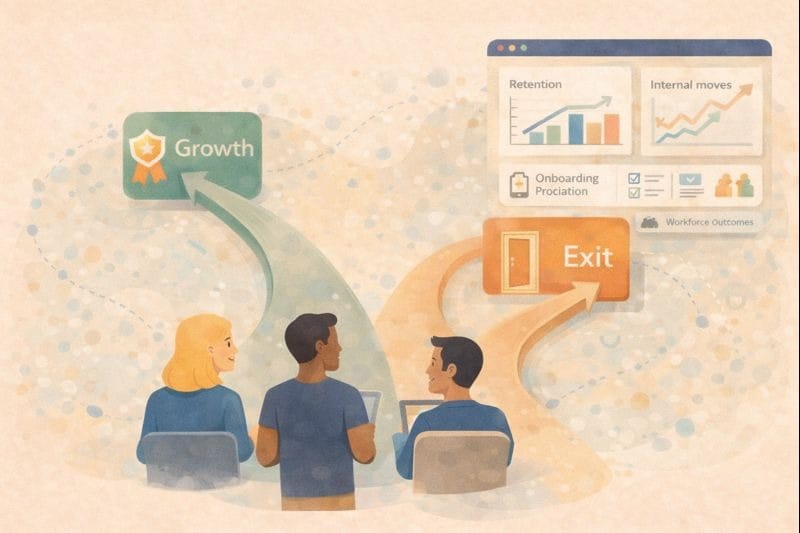
These are lagging indicators, but they’re the ones leadership cares about most. They show what engagement looks like in real workforce outcomes.
Voluntary Turnover Rate
What it tells you: Retention risk and employee choice, who is leaving and if the organization is losing talent it intended to keep.
How to measure it: Track voluntary exits (resignations) as a percentage of average headcount.
Formula: (Voluntary exits ÷ Average headcount) × 100
Employee retention rate
What it tells you: Your ability to keep employees over time, especially in key roles and high-performing groups.
How to measure it: Measure how many employees remain over a given period, excluding new hires, depending on your reporting approach..
New hire retention / “passed probation” rate (90–180 days)
What it tells you: If onboarding, role clarity, and manager support are strong enough to retain employees through the most vulnerable period of employment.
How to measure it: Track the percentage of employees still employed after 90 or 180 days (or after the formal probation period).
How to use it: Early attrition is expensive and avoidable. If new hire retention is low, it usually points to onboarding gaps, unrealistic role expectations, poor manager support, or a mismatch between hiring messaging and reality.
Internal mobility rate (promotions + lateral moves)
What it tells you: If employees have real growth pathways and career opportunities inside the organization.
How to measure it: Track promotions and lateral moves as a percentage of eligible employees.
Formula: (Internal moves ÷ Eligible employee pool) × 100
4) Operational warning signs (early engagement risk signals)
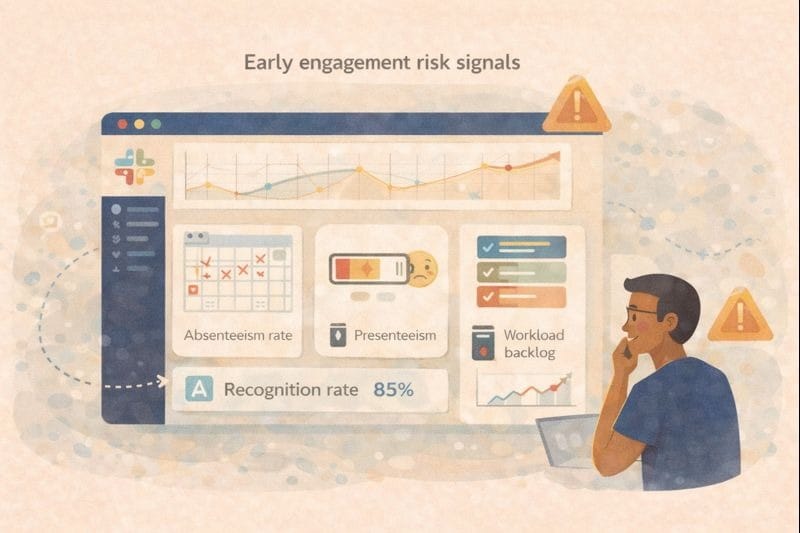
These are the real-world signals that something’s off, especially in teams where employees won’t say it directly in a survey.
Absenteeism rate (unplanned)
What it tells you: Stress, disengagement, or wellbeing strain, especially when absenteeism spikes in specific teams or time periods.
How to measure it: Track unplanned absence days against total available workdays.
Formula: (Unplanned absent days ÷ Total available workdays) × 100
Presenteeism (proxy metric)
What it tells you: Employees are technically present, but struggling to show up without being fully productive due to burnout, stress, or low motivation.
How to measure it: Presenteeism is rarely captured through a single system metric. It’s best measured through a combination of:
- pulse survey indicators (energy, workload, ability to focus)
- manager observations
- workload signals (constant overtime, chronic backlog)
KPI Cheat Sheet (Formulas + Suggested Cadence)
Conclusion
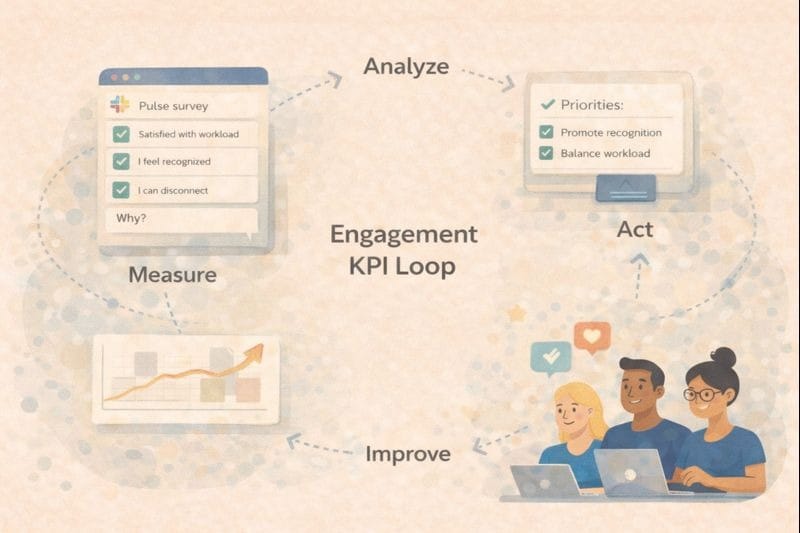
Employee engagement and satisfaction are measurable; you just need to track the right KPIs consistently and actually do something with what you learn. Start with a small core set, build a simple reporting rhythm, improve your measurement system over time and see how you grow a highly engaged workforce.
.👉 If you want to start tracking employee engagement KPIs quickly, measure employee engagement in Slack with Pulsy by BuddiesHR, no external portal required, and easy to roll out across teams.
Frequently asked questions
What KPIs demonstrate employee engagement?
The strongest employee engagement KPIs include eNPS, engagement score, pulse survey score, recognition participation rate, survey response rate, voluntary turnover, and unplanned absenteeism. Together, these employee engagement metrics show both sentiment and real-world outcomes.
What are the main indicators of employee engagement?
Common indicators of employee engagement include high motivation, strong commitment to goals, positive advocacy, consistent participation in feedback and recognition, and lower burnout risk. In practice, engaged employees often demonstrate stronger collaboration, initiative, and consistent performance.
What’s the difference between employee engagement and employee satisfaction?
Engagement reflects how emotionally and behaviorally invested employees are in their work. Satisfaction reflects how employees feel about their job experience (workload, leadership, culture, growth, and support). Employees can be satisfied without being fully engaged, which is why tracking an employee satisfaction index can complement engagement data.
What is a good eNPS score?
A “good” eNPS depends on your industry and baseline, but in general:
- Above 0 is a positive sign
- Above 30 is strong
- 50+ is excellent
The most important factor is tracking trends over time and comparing results across teams to understand overall sentiment and satisfaction.
How often should you measure employee engagement KPIs?
A practical cadence is:
- Pulse surveys: monthly (or biweekly)
- eNPS: quarterly
- Engagement surveys: quarterly or biannually
- Turnover + absenteeism: monthlyConsistency matters more than frequency, especially when you’re tracking changes in your engaged workforce over time.
What’s the best way to improve employee engagement using KPI data?
Start by segmenting results (team, manager, tenure), then focus on 1–2 priority drivers (like workload, employee recognition, or growth). Take visible action, communicate progress (“You said, we did”), and re-measure to confirm improvement.