Employee satisfaction survey: why 4.2 out of 5 proves little
A 4.2 out of 5 can hide an unhappy team. See what an employee satisfaction survey measures, how to read the score, and the eight questions worth asking.


An employee satisfaction survey tells you how content people are with their working conditions. That's useful, and it's also less than most teams assume. A team can average 4.2 out of 5 and still lose its two best people next quarter, because satisfaction measures whether the conditions are acceptable, not whether anyone plans to stay.
This guide covers what a satisfaction survey does and doesn't measure, why the average hides more than it shows, and eight questions to ask instead of forty. There's a free score reader in the middle that turns your answer counts into a plain-English reading.
What an employee satisfaction survey measures
Satisfaction is how people feel about the conditions of the job: pay, workload, tools, their manager, the working environment. Rippling and Sogolytics, two of the guides that rank for this term, define it the same way, and it's a fair definition (Rippling, Employee satisfaction survey; Sogolytics, Employee satisfaction survey). Neither cites a study, and neither says how to read the score once you have one. That second part is where most satisfaction surveys go wrong.
Satisfaction vs engagement: where the line sits
Gallup draws the line this way. Engaged employees are "psychologically committed to their work", while satisfaction is "a broad, attitudinal outcome" that is harder to act on. Gallup's position is that engagement predicts satisfaction, and that satisfaction works best as one insight inside a wider engagement picture (Gallup, Engagement vs. satisfaction among hospital teams, 2004).
Frederick Herzberg's research points the same way from the other side. In the Harvard Business Review he reported that what creates satisfaction differs from what causes dissatisfaction: a poor boss, low pay or pointless rules make people unhappy, but fixing them doesn't motivate anyone. The work itself does (Herzberg, One more time: how do you motivate employees?).
So a satisfaction survey is good at one job: finding what's irritating. Fix a bad tool or an unmanageable workload and people stop being unhappy. It won't tell you whether they're committed. Gallup's 2026 report puts 20% of employees worldwide as engaged in 2025, with 64% not engaged and 16% actively disengaged (Gallup, State of the Global Workplace 2026). Our reading, not Gallup's: plenty of the "not engaged" majority would still tick "satisfied". For the commitment side, see the employee engagement survey guide and eNPS.
Why 4.2 out of 5 proves little
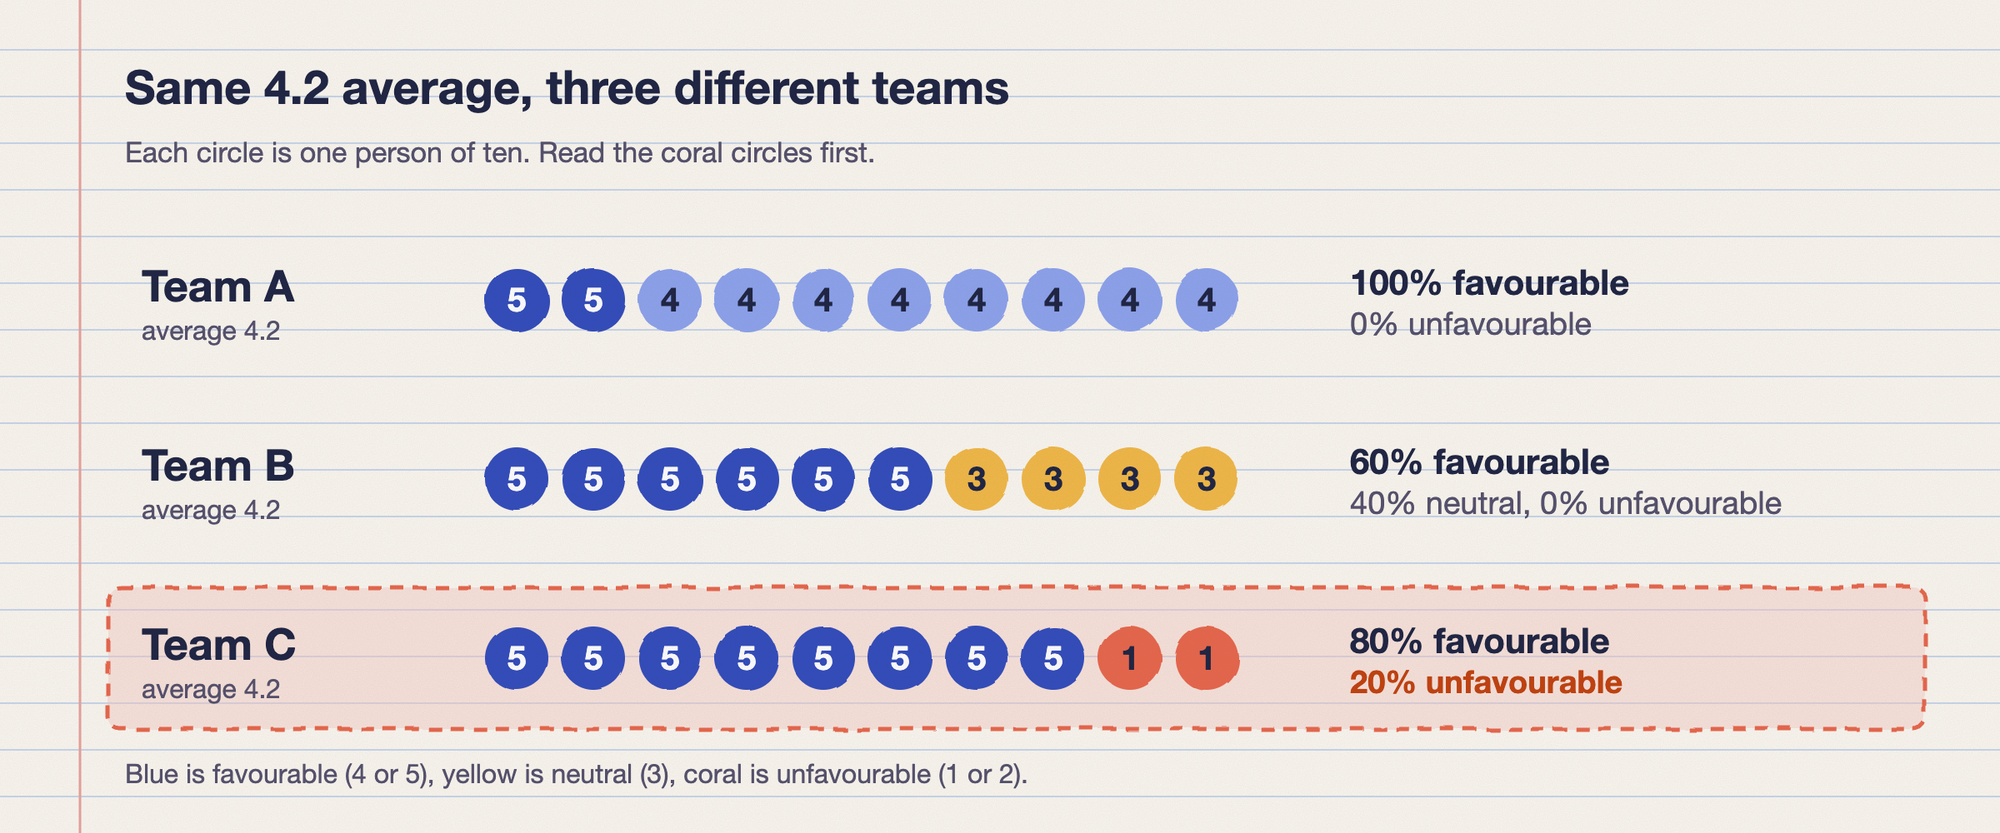
An average squashes ten different answers into one number. Here are three teams of ten, all averaging exactly 4.2. These are our own examples, built to make the point.
Team A answered eight 4s and two 5s. Team B answered six 5s and four 3s. Team C answered eight 5s and two 1s. The averages match, and the stories don't. Team A is steadily content. Team B is split between delighted and lukewarm. Team C is mostly delighted, with two people who picked the lowest score available. Team C is the one that loses somebody, and the average gave no hint.
Read your score with three numbers
Instead of the average alone, read three numbers together: the average, the share favourable (answers of 4 or 5), and the share unfavourable (answers of 1 or 2). Start with the unfavourable share. If one in five people picked 1 or 2 on a question, someone is unhappy about it, however good the average looks.
On benchmarks, most guides don't give one, and the ones that do rarely say where it came from. Compare each question with your own last round instead. Type the number of people who picked each answer into the reader below. Nothing is sent anywhere.
Satisfaction score reader
Enter how many people gave each answer to one question. Change any number and the reading updates.
Average score
4.1
The readings are our rules of thumb, not research. The margin is the worst-case figure for a share, 1.96 x sqrt(0.25 / answers), adjusted for your headcount when you give it. It assumes the people who answered are a fair sample of the people you invited, which is the part a survey can't promise.
With the defaults, 40 answers from 60 people give an average of 4.1, about 78% favourable and 8% unfavourable, give or take about 9 points. That's a healthy question. Now enter 8 for the 1s, 0 for the 2s and 3s, 8 for the 4s and 24 for the 5s. The average only drops from 4.1 to 4.0, but the reading flips to "someone is unhappy". That flip is the whole reason to read the shares.
Eight questions that cover the ground
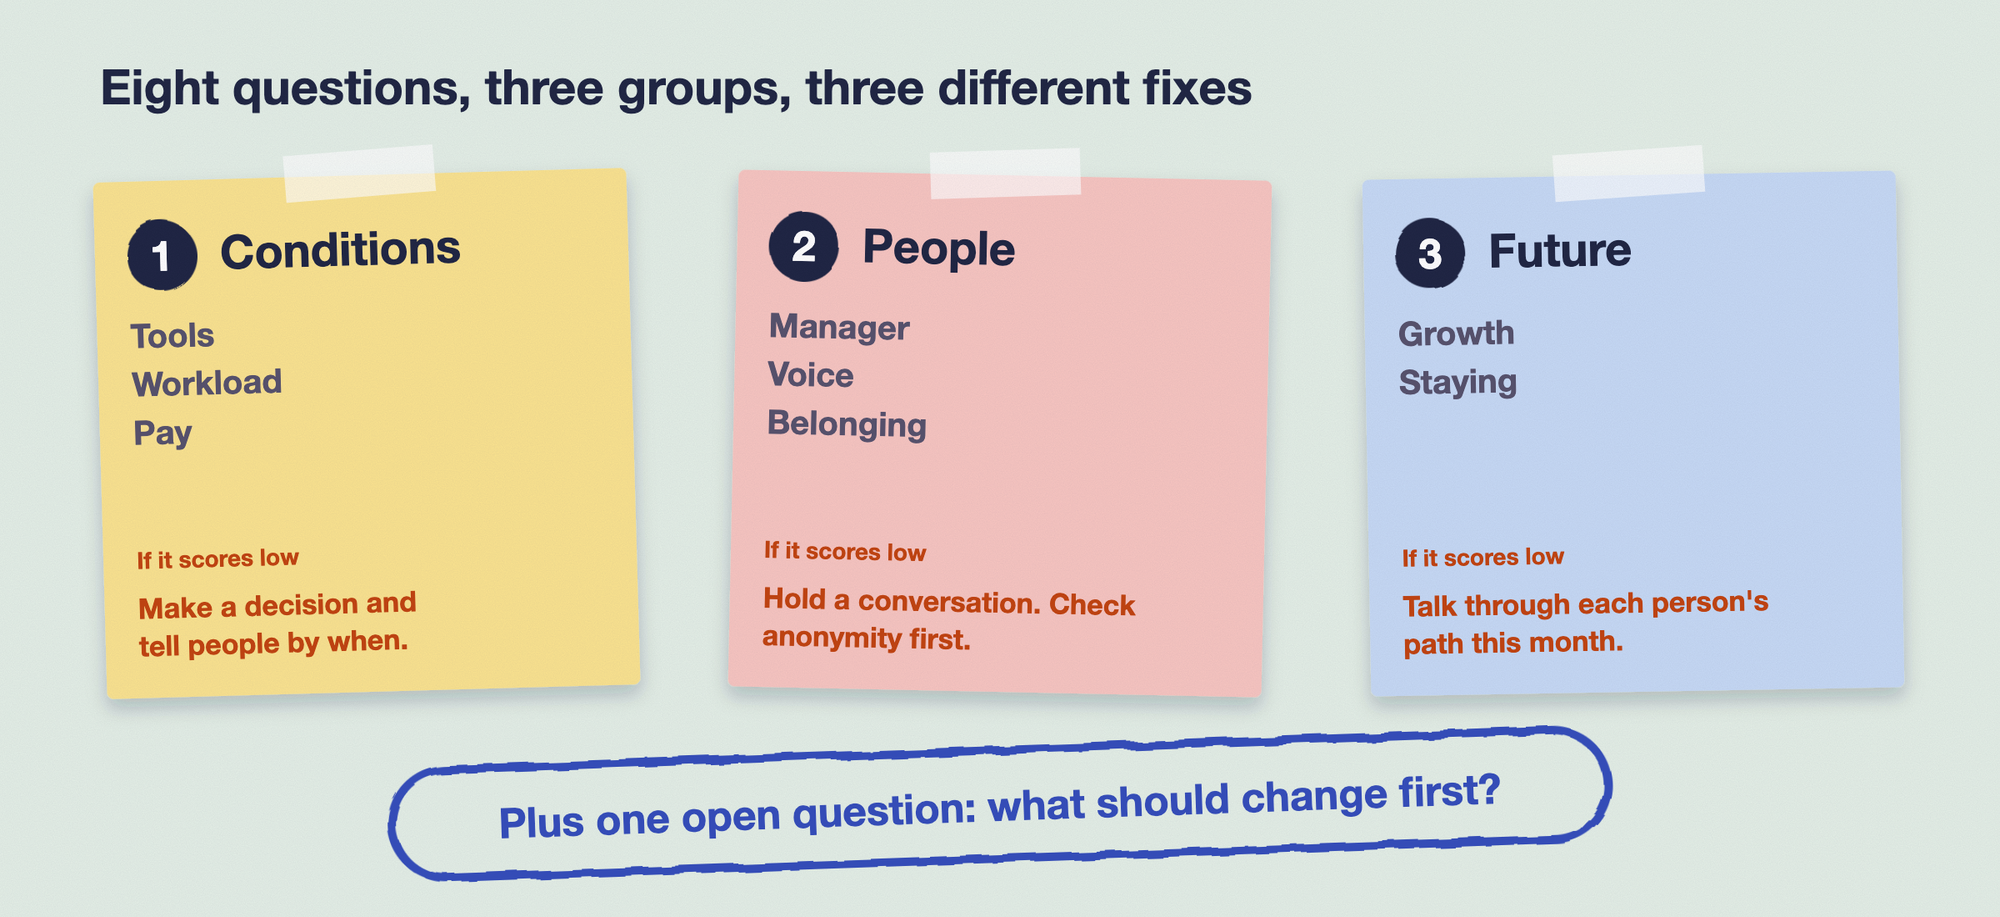
The guides ranking for this term offer 40 to 50 questions. Long surveys get thin, rushed answers, and nobody acts on 40 results. Eight is enough to find what's irritating and to see whether people see a future here. Use a five-point scale and label every point, from "strongly disagree" to "strongly agree".
- Tools: I have what I need to do my job well.
- Workload: My workload is manageable most weeks.
- Pay: I feel fairly paid for the work I do.
- Manager: My manager helps me do my best work.
- Voice: I can raise a problem without worrying about it.
- Belonging: I feel part of the team.
- Growth: I can see how I'm growing here.
- Staying: I see myself working here in a year.
Add one open question: "What's the one thing we should change first?" The comments tell you what to do with the numbers. The "voice" question depends on people believing the survey is anonymous, so read anonymous employee survey before you promise it, and see psychological safety at work if that question scores low. For longer banks on the engagement side, the engagement survey questions guide has them.
The three groups behave differently when they score low, which is why the diagram below splits them. Conditions are decisions you can make. People questions need a conversation. The future questions are the early warning.
How often to run it
Twice a year is a sensible rhythm for the eight questions, with a short pulse in between when something changes, such as a reorganisation or a new policy. Gallup's guidance on employee surveys suggests a semiannual engagement survey plus quarterly or monthly pulses, and analysis within days or weeks, not months (Gallup, Employee surveys). A 40-question annual survey that takes two months to report is answering last quarter's question. See pulse survey for the short recurring version.
After the score: one change, one owner
Gallup warns that when nothing happens after a survey, engagement is likely to fall. Perceptyx, a survey vendor, reports that 74% of organisations that acted on survey results improved engagement, against 8% of those that didn't (Perceptyx, What is an employee pulse survey). It's a vendor figure with no stated sample, so read it as a direction. The direction is hard to argue with.
Pick the lowest-scoring question that you can actually change within 30 days. Name one owner, say what will change and by when, and tell the team before the next survey goes out. Gallup also says managers account for 70% of the variance in team engagement, so the owner is usually a manager, not HR. The employee engagement survey guide has a three-level split for who owns which change.
Running an employee satisfaction survey in Slack or Teams
A long survey sent as an email link to a separate tool is a portal, and portals get thin, self-selected answers. That's our view rather than research, but it matches what we see: the further a survey sits from where people already work, the fewer answer.
Pulsy sends surveys as a Slack or Microsoft Teams message that people answer in the thread. It includes pre-built survey templates, an anonymity setting per survey that employees can see before they answer, segmentation in the web dashboard for groups of five or more, and exportable reports. Its smart notifications and reminders drive an 80%+ response rate, which is BuddiesHR's own product data, not independent research. 1,000+ HR teams use BuddiesHR, which has a 4.8/5 rating on G2, and Pulsy is free under 10 employees.
Install Pulsy free and send your eight questions this week. The use-case view is on the measuring engagement page, and the setup steps are in how to create a survey in Slack.
FAQ
What is a good employee satisfaction score?
There isn't a universal one, and be wary of any guide that gives a benchmark without naming where it came from. Compare each question with your own last round, and watch the share of 1s and 2s more closely than the average.
How many questions should an employee satisfaction survey have?
Eight, plus one open question, is enough to find what's irritating people and whether they see a future with you. Longer surveys get rushed answers, and each extra question is one more result nobody will act on.
What's the difference between employee satisfaction and engagement?
Satisfaction is how content people are with their working conditions. Engagement is how committed they are to the work. Gallup treats satisfaction as one insight inside engagement, and Herzberg's research suggests fixing conditions removes unhappiness without creating motivation.
How often should you run an employee satisfaction survey?
Twice a year for a short set like the eight above, with a pulse in between when something changes. Report within days or weeks, and share one change with the team before the next round.